There are a few things I really geek out over. PBS style documentaries on stuff like Fractal geometry or spontaneous combustion and dramatic weather event updates on the weather channel always get my juices flowing. Something about that threatening beeping sound and the flashing red warning signals when severe thunderstorms are coming through just really arouses my interest. That’s a terribly lame admission but hey, I do get excited over much cooler things too like aggressive dutch kickboxers and the Anthony Bourdain show “No Reservations“. I’m not a complete nerd, I’m just about 85% nerd.
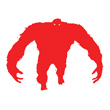
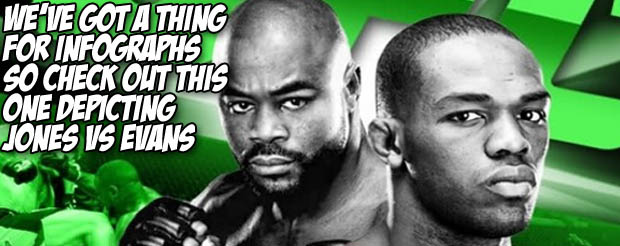
I also really love pictorial graphs and charts. I’m not talking about the ones that the boss projects onto a white board during a power point presentation on the financial advantages of switching printer supply brands. I’m talking about fun picto infographs about important stuff like how to make mixed drinks or a display of haircuts found in musical history or even MMA. Of course the MMA infographs are nearest and dearest to my heart and this one found on mashable.com , depicting the Jones vs Evans fight-is my new favorite. Check it out: